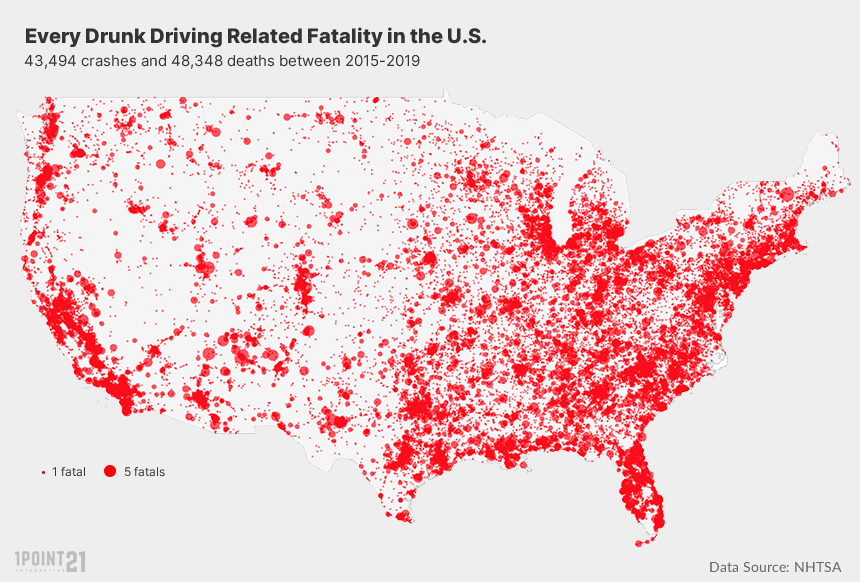
Because drunk driving crashes are so prevalent, we wanted to find out more. When are they the most likely to occur? Are certain days more dangerous? Do some states have bigger problems than others? We worked with data visualization agency 1Point21 Interactive to analyze fatal crash data from 2015-2019 to find out.
Case 1: Manhattan Beach High School Senior – May 2025
In the early morning hours of May 4, 2025, 18-year-old Braun Levi was walking with a friend in Manhattan Beach, California, when his life was cut short by a repeat drunk driver. The Loyola High School senior and tennis star, who had recently lost his family home in the Palisades Fire, was struck and killed by 33-year-old Jenia Belt. She was arrested at the scene and is facing multiple felony charges, including murder and driving under the influence. The talented athlete, described as ‘exceptional’ by his community, was just weeks away from graduating when his bright future was ended by someone who had already been given a second chance and squandered it.
Case 2: Miami Gardens Family Tragedy – February 2025
At 6 p.m. on Saturday, February 8, 2025, what should have been a joyful birthday celebration at the movies in Miami Gardens, Florida, became an unthinkable tragedy. Antonio Wilcox Jr., 25, was speeding at 99 mph while drunk when his black Kia Sorento rear-ended a white Nissan Altima carrying a family. The collision killed 56-year-old grandmother Rosa Jones and three of her grandchildren who were celebrating a birthday. Wilcox was booked into the Broward jail on four counts of vehicular homicide in a reckless manner.
Case 3: High-Speed Phoenix Crash – September 2024
At 6:30 a.m. on September 22, 2024, a drunk driver speeding at 140 mph in a white Toyota Camry slammed into 42-year-old Craig Cooper on his motorcycle on I-10 in Phoenix. The father of two was rushed to the hospital but died from his injuries. The driver, Andrew Ramirez Perez of Surprise, Arizona, has since been booked into the Maricopa County jail on one count of second-degree murder. He is being held on a $250,000 cash-only bond.
Most Recent Crash Data from 2023
There is no debate that alcohol use and drunk driving are significant factors in traffic crashes in the United States. Daily average: 34 people die daily in drunk driving crashes. This amounted to 43,494 crashes and 48,348 deaths that may have been completely preventable.
- 2022: 13,524 alcohol-impaired driving deaths (32% of all traffic fatalities)
- 2023: 12,429 alcohol-impaired driving deaths (7.6% decrease from 2022)
- 2024 projection: 39,345 total traffic fatalities (3.8% decrease from 2023)
According to the latest crash data from NHTSA, there was a significant decrease in the number of fatalities in alcohol-related crashes reported by the police in two consecutive years of decline (2022-2023). In 2023, alcohol-impaired driving deaths decreased by 7.6% from 2022 data.
37 states reported declines in drunk driving fatalities between 2022 and 2023.
Deadliest or Most Dangerous Days
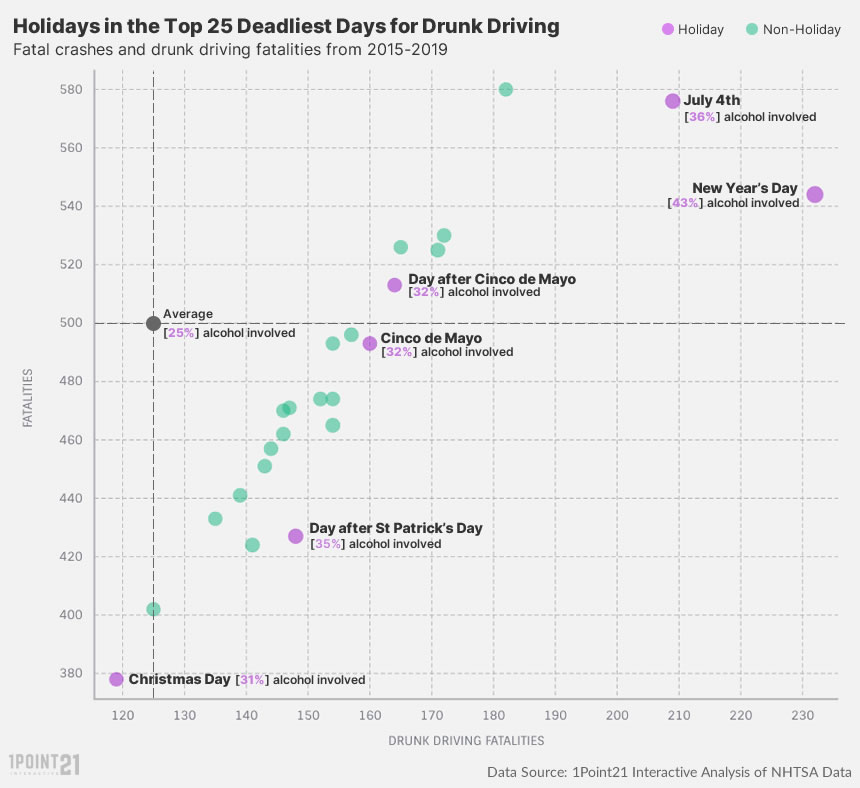
The three most dangerous days are either holidays or the day after a holiday – New Year’s Day, The Fourth of July, and the day after St. Patrick’s Day.
Holidays with High Drunk Driving Risks:
- New Year’s Day – The deadliest day for drunk driving, with an 89% higher risk compared to the average day.
- Independence Day – With celebrations, parties, and cookouts, the risk increases by 46%.
- Memorial Day – Marked by parades and gatherings, leading to a 45% higher drunk driving risk.
- Labor Day – A popular long weekend with an increased risk of 54%.
- Thanksgiving – Known for large meals and alcohol consumption, contributing to a 55% higher risk.
- St. Patrick’s Day – A holiday associated with heavy drinking, prompting police departments to set up DUI checkpoints.
Days of the Week with Higher Risks:
- Saturdays – A prime day for social events, celebrations, and increased alcohol consumption.
- Fridays – A day with a high number of alcohol-related crashes as people kick off the weekend.
Additional Contributing Factors:
Several other elements can increase the likelihood of drunk driving, including:
- Happy hour promotions that encourage excessive drinking.
- Bar closing times, leading to a surge in impaired drivers on the road.
- Reduced nighttime visibility, making it harder to detect impaired drivers.
- Limited public transportation, leaving people with fewer safe alternatives to driving.
Taking extra precautions on these high-risk days can help reduce accidents and keep roads safer.
When examining this data, it’s easy to look at totals to see which days are deadliest. In general, fatal drunk driving collisions are much more likely to occur on Friday (15 percent), Saturday (24 percent), and Sunday (22 percent).
However, to find out which specific days road users may be at higher risk of being killed by a drunk driver, we went beyond total volume. We calculated the percentage of total fatal crashes that involved at least one drunk driver.
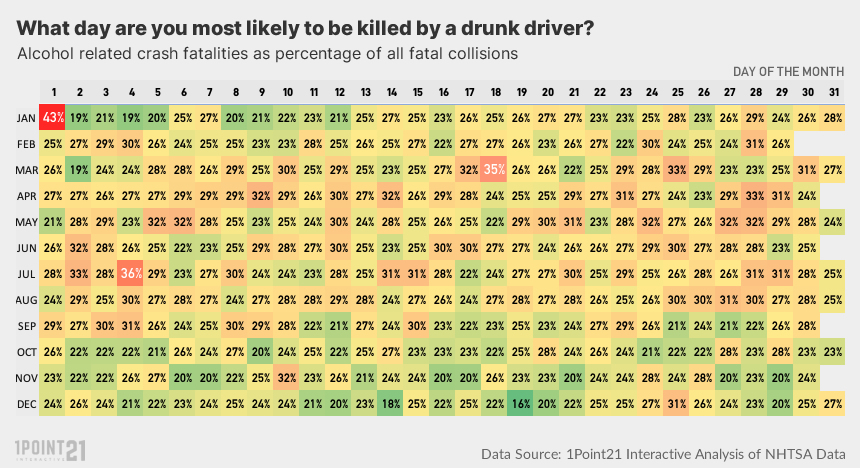
In fact, among the 25 days with the highest percent of drunk driving crashes, seven are either fixed date holidays or the day after a fixed date holiday.
The 25 Most Dangerous Days for Drunk Driving
| Rank | Date | Alcohol Related Fatal Crashes |
Fatal Crashes | Percentage of Crashes Involving Alcohol |
|---|---|---|---|---|
| 1 | January 1st | 232 | 544 | 43% |
| 2 | July 4th | 209 | 576 | 36% |
| 3 | March 18th | 148 | 427 | 35% |
| 4 | March 25th | 141 | 424 | 33% |
| 5 | April 28th | 154 | 465 | 33% |
| 6 | July 2nd | 171 | 525 | 33% |
| 7 | April 9th | 154 | 474 | 32% |
| 8 | May 25th | 172 | 530 | 32% |
| 9 | May 6th | 160 | 493 | 32% |
| 10 | May 28th | 152 | 474 | 32% |
| 11 | May 5th | 164 | 513 | 32% |
| 12 | May 24th | 143 | 451 | 32% |
| 13 | November 10th | 157 | 496 | 32% |
| 14 | June 2nd | 146 | 462 | 32% |
| 15 | April 14th | 139 | 441 | 32% |
| 16 | March 17th | 144 | 457 | 32% |
| 17 | December 25th | 119 | 378 | 31% |
| 18 | July 14th | 182 | 580 | 31% |
| 19 | July 15th | 165 | 526 | 31% |
| 20 | July 29th | 154 | 493 | 31% |
| 21 | August 27th | 147 | 471 | 31% |
| 22 | April 29th | 135 | 433 | 31% |
| 23 | February 28th | 125 | 402 | 31% |
| 24 | May 21st | 146 | 470 | 31% |
| 25 | July 28th | 166 | 536 | 31% |
New Year’s Day: The Deadliest Day
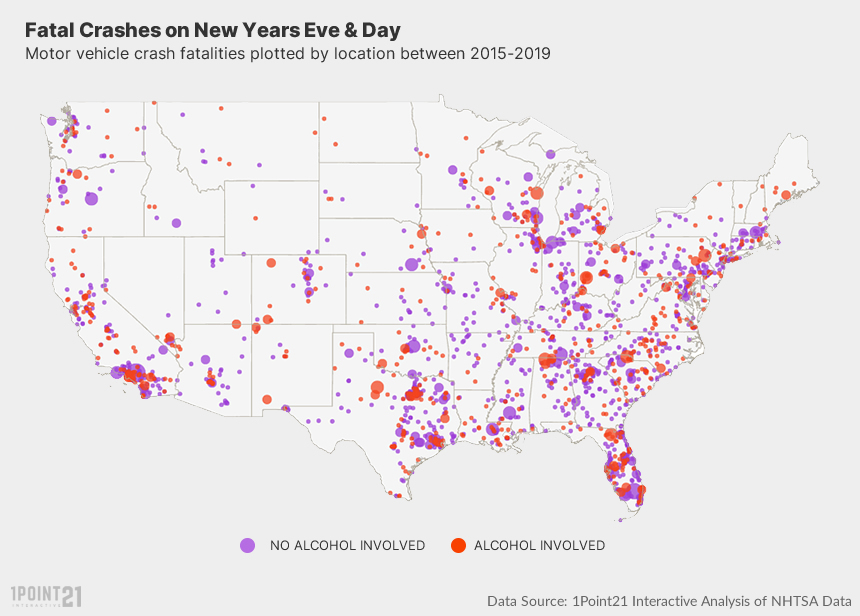
We found that New Year’s Day is – by far – the deadliest and most dangerous day of the year in terms of drunk driving. While this day had only two more drunk driving fatalities than the next closest day – the Fourth of July – 43 percent of all fatal crashes were alcohol-related. Over the five-year study period, there were 232 fatal crashes and a total of 255 people killed on New Year’s Day from alcohol-impaired crashes.
We also found that there were more than twice as many crashes and fatalities on New Year’s Day between midnight and 4 a.m., compared to 8 p.m. to midnight on New Year’s Eve. Once the new calendar year begins, the roads become much more dangerous.
The Fourth of July
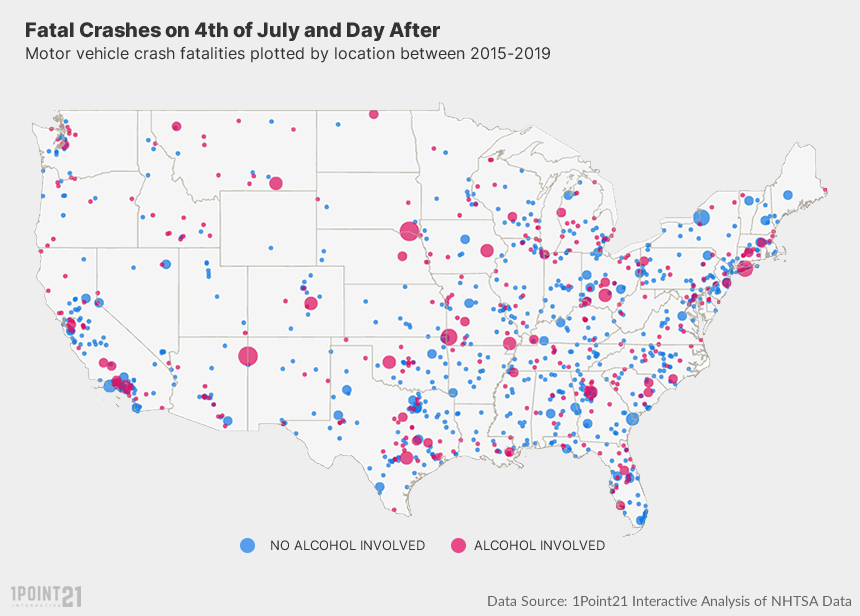
The second deadliest day for drunk driving was the Fourth of July, behind only New Year’s Day. A total of 253 people were killed in alcohol-related collisions on this summer holiday and 36 percent of all fatal crashes (209) involved at least one drunk driver.
On Independence Day, the deadliest hour is 10 p.m., most likely when people are driving home after watching the fireworks show. People are already under a holiday daze, but when that state of mind is combined with alcohol and high traffic, the result can be dangerous.
St. Patrick’s Day
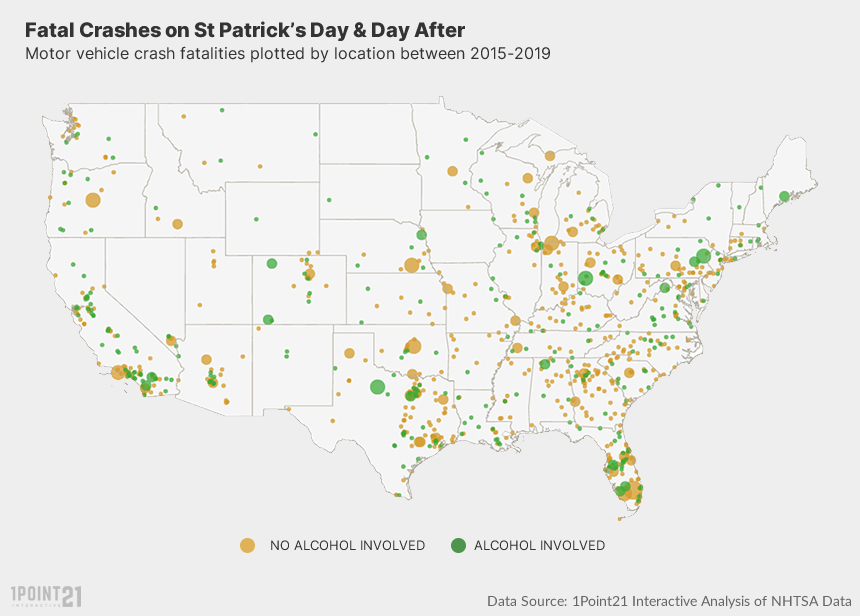
St. Patrick’s Day, March 17th, is celebrated by people of all backgrounds around the world. As another heavy drinking holiday in the U.S., both St. Patrick’s day and the day after are extremely high-risk days for fatal drunk driving accidents. On March 18th, 35 percent of all fatal crashes involved alcohol – the third-highest percentage of any day – while 32 percent were alcohol-related on St. Patrick’s Day.
The most alcohol-related fatal crashes on the 17th and 18th occurred in: California (46), Texas (29), Florida (27), Virginia (13) and Louisiana (11). Three of the four counties on these two days were in California: Riverside (7), Los Angeles (6) and Kern (4), with Arizona’s Maricopa County (7) rounding out the top five.
Cinco de Mayo
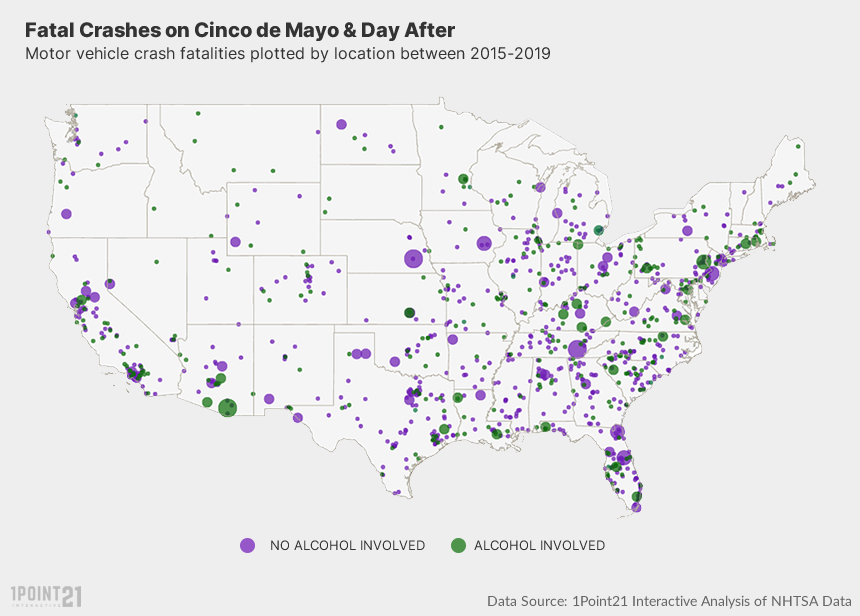
Cinco de Mayo, celebrated on the 5th of May, is very often mistaken as “Mexican Independence day.” However, this holiday actually celebrates the Mexican Army’s victory over the French in the Battle of Puebla. In the U.S., it is seen as a day to celebrate Mexican culture and heritage. It’s also one of the heaviest drinking holidays, along with the two listed above. As such, both the 5th and 6th of May are among the most dangerous days for fatal drunk driving accidents. Just over 32 percent of all crashes on both days involved at least one drunk driver.
Christmas Day
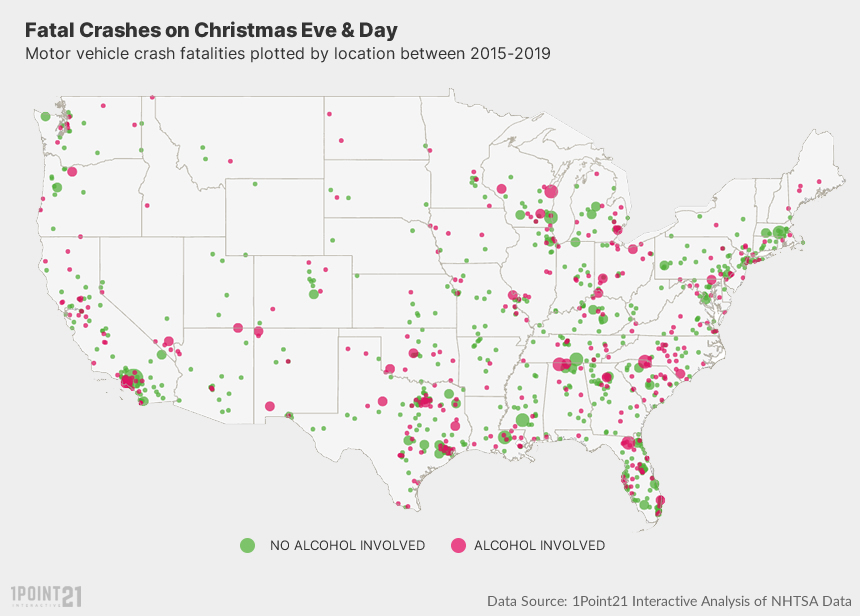
While Christmas day has a relatively low number of drunk driving-related crashes, they make up a high percentage of all fatal crashes at 31 percent. Christmas day is not generally thought of as a focus day for drunk driving prevention, but it appears that it should be added to the discussion. California and Florida led the way in these types of crashes with 20 and 17 respectively, more than double that of third-place Texas (8).
Deadliest Hour of the Day
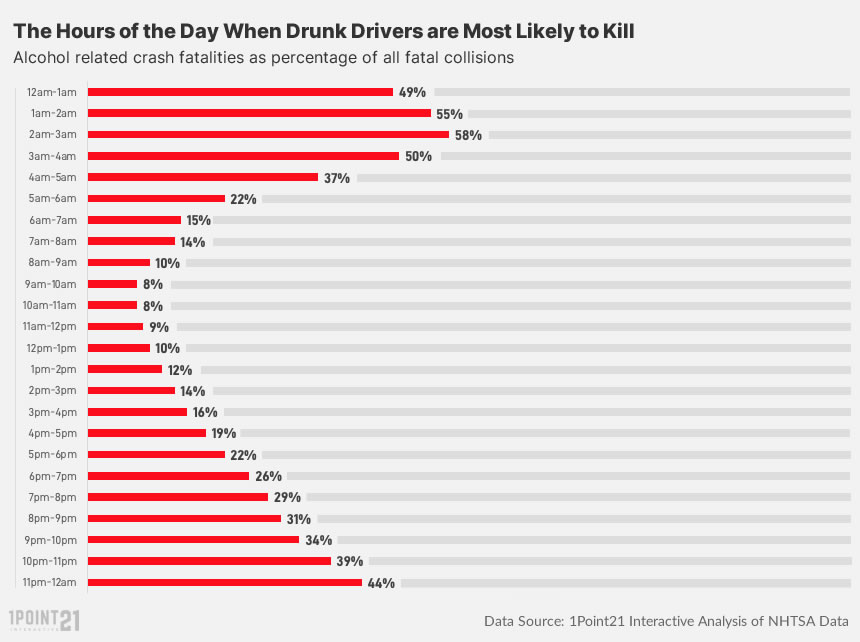
While all fatal crashes peak at 6 p.m. – the height of rush hour – the most dangerous hours of the day for drunk driving aren’t during the day at all. In fact, fatal crashes involving alcohol are much more common late at night and in the early hours of the morning, especially between midnight and 3 AM. This is when the number of impaired drivers on the road tends to be highest, often after attending social events or bars.
During this hour, 3,540 alcohol-related fatal crashes occurred – a full 58 percent of all collisions. This explains why so many of the most dangerous days come the day after a heavy drinking holiday.
| Hour | Drunk Driving Crashes |
Drunk Driving Deaths |
All Crashes | All Deaths |
|---|---|---|---|---|
| 12am | 3112 | 3473 | 6402 | 7027 |
| 1am | 3289 | 3688 | 6087 | 6712 |
| 2am | 3540 | 3963 | 6178 | 6817 |
| 3am | 2265 | 2549 | 4661 | 5134 |
| 4am | 1460 | 1629 | 4025 | 4357 |
| 5am | 1141 | 1250 | 5399 | 5756 |
| 6am | 910 | 1005 | 6354 | 6790 |
| 7am | 774 | 852 | 5747 | 6247 |
| 8am | 448 | 496 | 4678 | 5023 |
| 9am | 370 | 405 | 4706 | 5095 |
| 10am | 409 | 455 | 5172 | 5613 |
| 11am | 559 | 614 | 5991 | 6548 |
| 12pm | 631 | 709 | 6584 | 7233 |
| 1pm | 854 | 942 | 7208 | 7873 |
| 2pm | 1069 | 1193 | 7825 | 8560 |
| 3pm | 1337 | 1477 | 8593 | 9424 |
| 3pm | 1603 | 1792 | 8600 | 9459 |
| 5pm | 2007 | 2218 | 9275 | 10071 |
| 6pm | 2447 | 2726 | 9727 | 10529 |
| 7pm | 2650 | 2928 | 9241 | 9958 |
| 8pm | 2872 | 3183 | 9576 | 10297 |
| 9pm | 3072 | 3418 | 9393 | 10151 |
| 10pm | 3063 | 3409 | 8135 | 8803 |
| 11pm | 3114 | 3446 | 7297 | 7918 |
Do Some States Have Bigger Problems With Drunk Driving?
Based on this data, the answer appears to be yes. While large states such as California, Texas, and Florida have many times more fatal crashes than smaller states, those figures don’t tell you everything. We adjusted for both the percentage of total crashes and alcohol-related fatal crashes per capita. We found that those three states were at or below the U.S. average for both of those metrics.
Which states have the biggest problems?
Montana, North Dakota, and Rhode Island have the highest percentage of alcohol-related crashes in the United States, the only three states above 40 percent. All in all, 29 states and D.C. were above the national average of 26 percent.
Montana and North Dakota also have two of the highest rates of these crashes per capita (with Wyoming and South Carolina as the other two states with a crash rate of more than double the national average).
Polar Opposites
Interestingly, New York had the lowest number of any state in both metrics, with less than one fatal drunk-driving crash per 100,000 people and only 19 percent of fatal crashes involved alcohol. Montana, on the other hand, had the highest number in both metrics, with 7.28 fatal drunk-driving crashes per 100,000 people and 44 percent of fatal crashes being alcohol-related.
| State | All Crashes | Drunk Driving
Crashes |
Alcohol Related
Percentage |
Alcohol Related
Crashes Per 100k |
|---|---|---|---|---|
| Montana | 878 | 389 | 44% | 7.28 |
| North Dakota | 504 | 213 | 42% | 5.59 |
| Rhode Island | 274 | 113 | 41% | 2.13 |
| Alaska | 344 | 132 | 38% | 3.61 |
| South Dakota | 528 | 190 | 36% | 4.30 |
| Wisconsin | 2680 | 930 | 35% | 3.19 |
| Vermont | 274 | 93 | 34% | 2.98 |
| Maine | 729 | 245 | 34% | 3.65 |
| Colorado | 2797 | 923 | 33% | 3.21 |
| Wyoming | 554 | 181 | 33% | 6.25 |
| Nebraska | 1035 | 335 | 32% | 3.46 |
| Ohio | 5211 | 1656 | 32% | 2.83 |
| Washington | 2530 | 803 | 32% | 2.11 |
| Louisiana | 3495 | 1107 | 32% | 4.76 |
| South Carolina | 4663 | 1472 | 32% | 5.72 |
| Idaho | 1066 | 323 | 30% | 3.61 |
| New Hampshire | 555 | 168 | 30% | 2.47 |
| Minnesota | 1754 | 525 | 30% | 1.86 |
| Virginia | 3769 | 1114 | 30% | 2.61 |
| Connecticut | 1307 | 385 | 29% | 2.16 |
| Massachusetts | 1687 | 494 | 29% | 1.42 |
| Oregon | 2158 | 629 | 29% | 2.98 |
| Illinois | 4808 | 1399 | 29% | 2.21 |
| Hawaii | 502 | 144 | 29% | 2.03 |
| New Mexico | 1685 | 478 | 28% | 4.56 |
| Michigan | 4622 | 1311 | 28% | 2.63 |
| Nevada | 1475 | 418 | 28% | 2.71 |
| Maryland | 2420 | 663 | 27% | 2.19 |
| District of Columbia | 130 | 35 | 27% | 0.72 |
| Missouri | 4200 | 1115 | 27% | 3.63 |
| North Carolina | 6534 | 1722 | 26% | 3.28 |
| Oklahoma | 3012 | 787 | 26% | 3.98 |
| Iowa | 1543 | 400 | 26% | 2.54 |
| Arkansas | 2375 | 615 | 26% | 4.08 |
| Delaware | 581 | 150 | 26% | 4.25 |
| California | 16359 | 4195 | 26% | 2.12 |
| Pennsylvania | 5366 | 1372 | 26% | 2.14 |
| West Virginia | 1288 | 329 | 26% | 3.67 |
| Texas | 16539 | 4143 | 25% | 2.86 |
| Kentucky | 3509 | 870 | 25% | 3.89 |
| Tennessee | 4827 | 1145 | 24% | 3.35 |
| Arizona | 4421 | 1042 | 24% | 2.86 |
| Alabama | 4317 | 998 | 23% | 4.07 |
| Florida | 14419 | 3058 | 21% | 2.85 |
| New Jersey | 2731 | 562 | 21% | 1.27 |
| Utah | 1226 | 244 | 20% | 1.52 |
| Georgia | 6975 | 1385 | 20% | 2.61 |
| Kansas | 1838 | 356 | 19% | 2.44 |
| New York | 4724 | 913 | 19% | 0.94 |
| Mississippi | 3024 | 541 | 18% | 3.64 |
| Indiana | 3881 | 684 | 18% | 2.03 |
Methodology & Fair Use
We analyzed 2015-2019 fatal crash data from the National Highway Traffic Safety Administration (NHTSA) to find out which days of the year had the most fatal crashes where alcohol was a factor.
If you are interested in republishing any of the data, images, or interactive elements included above, please provide credit by linking to this page.
Why This Study Matters & Tips to Stay Safe
While recent data shows encouraging progress—with alcohol-impaired driving deaths declining for two consecutive years from 13,524 in 2022 to 12,429 in 2023 – the tragic reality remains that 34 people still die every day in drunk driving crashes across America. That’s one person every 42 minutes, and the problem intensifies dramatically during holidays and celebrations.
Recent cases underscore why this issue demands continued vigilance. In February 2025, a Miami Gardens grandmother and three grandchildren were killed by a drunk driver speeding at 99 mph during what should have been a joyful birthday movie outing. In May 2025, an 18-year-old Manhattan Beach high school senior was struck down by a repeat offender driving on a suspended license from a previous DUI. These weren’t statistics – they were real families destroyed in preventable tragedies.
Is there such a thing as moderation on holidays? For most, holidays tend to be a time of excess: excess eating, excess buying, and excess drinking. It isn’t surprising then when people throw caution to the wind and act impulsively—on and off the road.
People’s behavior and choices are often influenced by social-environmental factors, specifically their friends or the hosts at the party, and whether they encourage or discourage drinking and driving.
However, days of celebration, of joy, do not have to lead to tragedy. The positive trend in fatality reduction proves that prevention efforts work. Thirty-seven states reported declines in drunk driving fatalities between 2022 and 2023, showing that collective action saves lives. Follow these enhanced safety tips to be part of the solution:
Safety Guidelines for 2025-2026
- Plan ahead with modern tools: Make sleeping or transportation arrangements ahead of time, with a clear mind. Use ride-sharing apps, designate drivers, or book nearby accommodations. Stick to your plan when alcohol starts to cloud your judgment. Today’s technology makes safe alternatives more accessible than ever.
- Leverage available resources: Call an Uber, Lyft, or any non-drinking driver to ensure roadway safety for you and those around you. There are even apps designed specifically for alcohol-impaired drivers:
- The Washington Regional Alcohol Program’s SoberRide offers free rides to impaired drivers on the deadliest days of the year: the December/January holiday season, including New Year’s, Independence Day, Cinco de Mayo, Halloween, and St. Patrick’s Day
- NHTSA offers SaferRide, an app tailored for people who have been heavily drinking and need a safe ride home. SaferRide is extremely accessible, with only three buttons on the home page: Get Taxi, Call Friend, and Where Am I?
- Set the right example and intervene: Whether you are a guest or host, don’t allow anyone you know to get behind the wheel after drinking. Make it clear that drinking and driving isn’t safe or acceptable under any circumstances. Remember: friends don’t let friends become the next tragedy. Help others find safe accommodations and be willing to take car keys if necessary.
- Enjoy responsibly: Holidays are about joy and spending time with loved ones, but that can get lost in the stress of celebration. It’s easy to overeat and binge drink. Make sure you’re not drinking to hide or avoid emotions. Set healthy boundaries for yourself, pace your consumption, and remember that the goal is creating positive memories – not endangering lives.
- Stay vigilant on high-risk days: If you’re driving during especially dangerous periods (holidays, late nights, weekends), stay extra alert. Look for signs of impaired driving: vehicles struggling to stay in their lane, swerving, sudden braking for no reason, inconsistent speeds, or other erratic behavior. Keep your distance and report suspected drunk drivers to authorities immediately.
- Support prevention technology: New federal initiatives are advancing impaired driving prevention technology that could become standard in vehicles. Support policies and technologies that make drunk driving physically impossible, not just illegal.
The bottom line: While we’ve made progress in reducing drunk driving deaths, every life lost represents a preventable tragedy. The families of Rosa Jones, Braun Levi, Craig Cooper, Brady Heiling, and Hallie Helgeson, and thousands of others, would still be whole today if just one person had made a different choice. That person could be you, and that choice could save a life.